A friend and I were reminiscing about college one time, and of course since we were both engineers the topic quickly got to what was the worst we had ever done on a test. He joked that whenever he or his friends got close to a 50% on a test they would reassure each other by saying "hey, 1 outta 2 ain't bad!"
Obviously, getting a 50% on a college test isn't desirable (although in some classes...especially in engineering...it can be about average), but phrasing it as "1 outta 2" certainly makes it seem better than it is.
And that is really a fundamental struggle with probability and statistics: what does a probability even mean? Sure, you can say things like "there is a 65.8% chance that event X will occur", but what do you do with that? How confident can you be that event X actually occurs?
This was a concept that many people became acutely aware of in the recent U.S. Presidential Election. Most outlets seemed fairly certain that, based on polling, Hillary Clinton would win comfortably. And most people believed that right up until reality smacked them in the face with a Donald Trump victory.
I remember looking at the Five Thirty Eight website just a few hours before the election and they had Hillary with about a 75% chance of winning. Since the website is usually pretty good at using their fancy algorithms to predict things, many people claimed after the election that "all the pollsters were wrong!". As this article points out, the polls actually weren't "wrong", there were just many media outlets that interpreted them incorrectly.
Using the Five Thirty Eight example, Hillary had a 75% chance of winning...which means that Trump still had a 25% chance of winning. 75% does not mean that it's "in the bag", it means that it is just better than a "toss up", which would be 50%.
There are a whole mess of things that can be concluded from probabilities, but before we dive into those let's get a few terms straightened out:
The terms "probability" and "statistics" are thrown around a lot and often used together, but knowing what they actually mean is very important. "Probability" is the determined likelihood that something will happen. It is a number between zero and one (inclusive) and is often represented as either a percentage or "odds". The latter is simply the inverse of the fraction, i.e. 2:1 odds means 50%, or 1/2, 10:1 odds means 10%, or 1/10. Probabilities can either be mathematically derived or derived from statistics, but more on that in a second. Probabilities that are mathematically derived represent things like a fair coin or a fair die. In each of these instances, it is assumed that the coin or die can take one of a discrete set of outcomes, each with equal likelihood. Mathematically derived probabilities can follow a multitude of other things, but this isn't a probability class so we won't beat it to death.
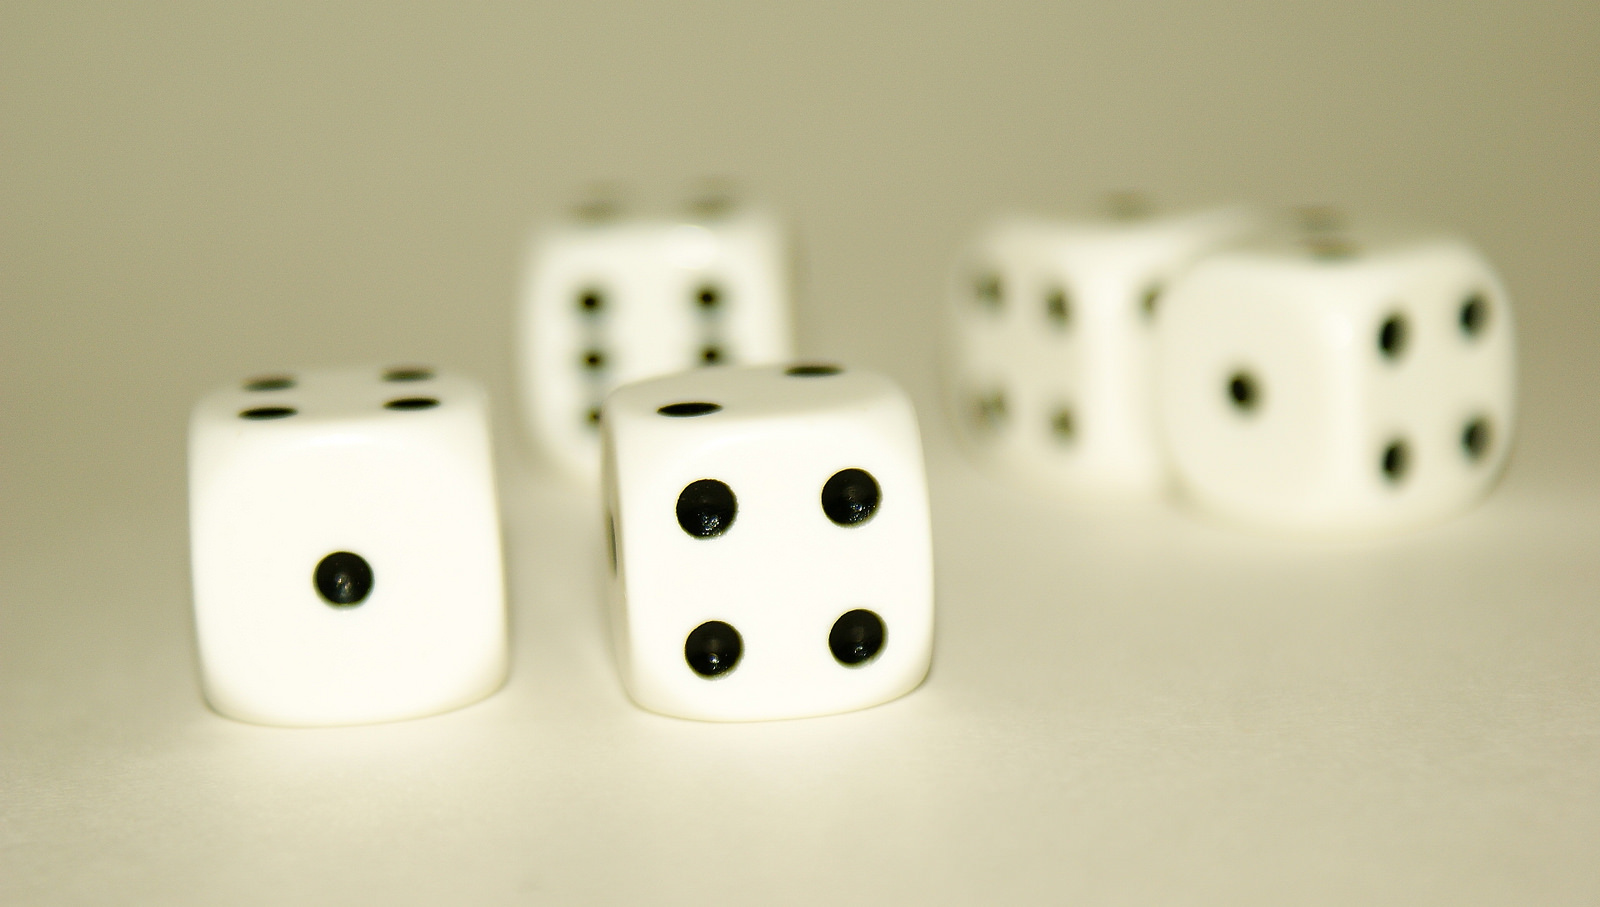
Why are we here? Because we're here. Why does it happen? Because it happens. Roll the bones.
Image Credit
"Statistics", on the other hand, represents the numerical analysis of data that has been collected. If you were to ask 10 people if they prefer chocolate or vanilla ice cream and 7 of them said "chocolate", then that would be a statistic. Statistics are often used to derive probabilities, and this practice can get quite complicated due to a variety of factors. In our ice cream example, could we assume that 70% of the United States prefers chocolate ice cream over vanilla? Hopefully you realize this would be a bad assumption. The nature of analyzing statistics in order to determine a probability depends heavily on things like sample size, validity of the experiment, etc. If you polled people for ice cream flavor in a chocolate shop and grimaced when you asked them if they preferred vanilla, then their answers might not accurately represent the opinions of a larger population.
In short: a probability is the likelihood of an event, and is basically used in an attempt to predict the future. A statistic is a collection of data from the past.
Now that we've got that covered, let's talk about how probability and statistics aren't always what they seem.
People love to use statistics in arguments. Media outlets and politicians use them all the time, and most people prefer when an argument is based on statistics because it seems logical and objective. "Numbers don't lie", they say. Well, numbers may not lie, but people certainly do, and people use statistics to mislead others all the time. In many cases this can be as easy as choosing the right statistics to lead people to the conclusion that you desire while ignoring any other statistics that might cause hesitation, and in other cases it can be a matter of simply phrasing things in such a way as to make a statistic seem more/less important than it is.
Small But Mighty
One important thing to remember is that the smaller the absolute number, the more impressive statistics of that number can seem. For example, if you wanted to make people think that airship-related deaths are a huge and growing problem, you could say something like "airship-related deaths have doubled in the past year!" This would certainly make people think that airships are a huge problem...until they realize that one person died as the result of an airship last year and 2 died this year, meaning that the number doubled (those numbers are made up, by the way). In an absolute sense, though, the number of airship-related deaths is quite small compared to the entire population, so one shouldn't be too concerned about being killed by an airship.
Probability and statistics are mostly used to predict how an event will turn out: who will win and election, which team will win a game, will your crush reject you, etc. Because we desire to know the answers to these questions before they happen for...reasons...a lot of people make a lot of money by trying to derive exact probabilities for the outcomes (well, maybe not the last example).
How Good Is "Good Enough"?
So when we are left with a number like 75% for the likeliness that Hillary will win the election, what do we do with that number? How high must a probability be before we can feel pretty confident that it will happen? 80%? 90%? 95%? 99.7%? These are questions that come up frequently in various types of science and engineering. The truth is, there isn't really a hard number that is universally deemed "good enough" for the confidence that a single test will succeed. In many cases, the desired number heavily depends on the risks involved. If failure to succeed is met with dire consequences, then the entities performing the test usually want to see probabilities of success that are above 90%, and maybe even above 95%. If NASA is launching a rocket, they don't want to see a measly 75% chance of success when hundreds of millions of dollars and people's lives are on the line.
Of course, there are other cases than just a single trial. If a company makes a product in high volume, then seemingly high probabilities can actually be quite low. For example, say a TV company makes 10,000 TVs every year. Their manufacturing processes are such that each TV has a 99.7% chance of working perfectly (if that number seems oddly specific, it is because it represents the yield within 3 standard deviations of a normal distribution). This means that there is only a 0.3% chance that the TV has a defect and will need to be returned. Seems pretty good, right? It does...until you figure that if the company makes 10,000 per year, then they would expect there to be 30 TVs that are returned. It's not a huge amount, but that also means that it there are probably 30 people who are writing extremely negative reviews about the TV online, which could be bad for business.
In many cases, what separates expensive products from cheap ones is the manufacturing quality. Usually companies with more expensive products take greater care in either the design of their products or in quality control such that the chance of a defect is extremely small. Companies with cheaper products may simply design them to be, say, 95% reliable, and just ship as is, knowing that 5% of the people who buy their products are going to be extremely unsatisfied. If these companies offer refunds, then they have simply calculated that the cost of reimbursing people for a defect is less than designing such that there are far fewer defects. The downside of this approach is that it can sully a brand name and make it synonymous with "doesn't work".
The Power of "AND"
Another way that seemingly "definite" probabilities can become reduced to more humble values is through repetition. If, for example, every time you take a step, you have a 99.99% chance of walking successfully with no problems whatsoever, then you might feel pretty confident that you will never trip. However, that is just the probability of successfully taking one step. Hopefully, you take more than one step every day, so what is the probability that you make it through the entire day without tripping? The week? The year? To figure this out, you need to find the probability that you take one successful step AND another AND another...and keep going until you have enough "ANDs" for the number of total steps. Long story short, the answer is to multiply all the probabilities together, or in this case take 0.9999 to the power of however many successful steps you want to take.
The average American takes about 5000 steps per day, meaning that the probability you go through a day without tripping if you have a "step success rate" of 99.99% is  . So there is a 60.65% chance that you make it through a day without tripping. Further, there is a 3.2% chance that you make it through a week without tripping, and about a 1 in 10^79 chance that you make it a year without tripping. Yes, that is a 10^79, a number that I don't think has an SI prefix.
So, always remember that high rates of an event can become drastically diminished if that event is repeated many times.
Is it Random?
When given a probability for a discrete event, always ask what is the probability that the outcome is chosen at random. If someone correctly guesses the result of a coin toss, you would (hopefully) not come to the conclusion that the person is an oracle, because you know that the probability of guessing the result of a coin toss is 50%. What if they correctly guess the result of a coin toss 10 times in a row? Well, the odds of doing that are 1024:1, so at that point you'd want to check if they are cheating somehow.
This is an important thing to realize because many less trivial cases can seem like there is validity to a hypothesis, when in reality the results were merely random chance.
Another thing to realize is that a result that is significantly worse than chance can be valuable. For example, the two most difficult scores to get on a true/false test are 100% and 0%. The odds of guessing all the answers and getting either score are 1/ 2^n, where n is the number of questions.
So if you answer every question on a true/false test to your best ability and get most or all of the answers wrong, then just pull a George Costanza and do the opposite of all your natural inclinations. You'll go from a dummy to a genius overnight!
The Troubles of Conditional Probability
Conditional Probability is basically the likelihood of an event if it is known that another event has occurred. What is the probability that you will get lucky tonight? Probably pretty low since you made it to the end of an article about probability. What is the probability that you will get lucky if you just got a text from a girl/guy you like saying that they are drunk? Probably better.
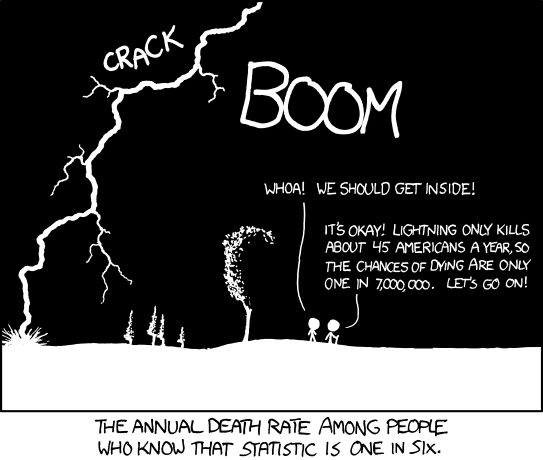
Conditional probability can, in many cases, drastically change the likelihood of an event. People usually use the odds of getting struck by lightning as a reference point to say that some event is very unlikely. Sure, in terms of raw numbers, not too many people get struck by lightning every year. But that's because most people have basic survival instincts that tell them it isn't a good idea to run around outside during a thunderstorm. If you climb to the roof of a tall building in a flat area during a lightning storm and hold a golf club in the air, your chances of getting struck by lightning go from astronomically low to pretty decent, and certainly not negligible (I don't know what the number is exactly, though).
When looking at statistics, always consider what conditions could affect the numbers. Media outlets can exploit statistics all too easily by casually ignoring that certain conditions may make the numbers meaningless.
Conclusion
Hopefully you've learned that probability and statistics are not always straight-forward. They represent our feeble attempts to predict the future based on the past, and are not always perfect. Probabilistic algorithms can get quite complex and are incredibly useful for a variety of applications, but always realize that they are merely predictions, not certainties. Very few things in life come with a 100% probability, so never think that something is "in the bag." That being said, don't live life thinking that you will always beat the odds, because you probably won't.
Always check up on the sources of statistics in news articles and try to find any conditions that might significantly alter the perception of the results. Just because a journalist is using a number to prove a point does not mean that the point is correct. Also be sure to understand the difference between "high-level" and "low-level" statistics. "High-level" statistics, such as those that say "half of marriages end in divorce" can be misleading. Many people hear that statistic (which is actually closer to 40%) and immediately apply it to their own lives. The tricky thing is that deeper analysis of this statistic reveals that one can greatly improve their chances of a successful marriage if they wait until their mid-20s or later to get married and are economically stable.
People may think that statistical evidence is a surefire way to win an argument. In many cases that could be right, but always remember to question everything.


Interesting! I learned a lot.